Debugging JavaScript in the browser

When developing with JavaScript a lot of what you’re building isn’t immediately visible. Most of the processes you write will operate silently under the hood of the browser. Having a tangible grasp on what’s going on in the background is key to understanding what you’re building and the effect your approach is having regardless of how simple or complex the system is.
Modern browsers offer a suite of built-in development tools. This is to inspect what’s going on and we’ll talk about a few common ways to debug the runtime environment of the web browser.

Photo by Sigmund
Basic logging
At the heart of the JavaScript debugging is the console. It’s a simple interactive JavaScript interface for running commands as well as reporting errors and key information.
You can take advantage of this in your applications by simply invoking the console.log function wherever you need to visibly see if your JavaScript has reached a certain point or view the value of a given variable.
console.log('This is a static message');

// Logging a variable
const foo = 1;
console.log(foo);

// Logging a mixture of items
console.log('Logs can have any number of arguments', foo, false);
The above JavaScript code outputs these messages to the console.
Simple logs can also be given some visual context so you can quickly see where things have gone awry. This can be done using the console.info, console.error, and console.warn functions:
console.info('This is an info message');
console.error('This is an error message');
console.warn('This is an warning message');
Logging DOM elements
In the case of variables containing document elements from the page (both visible and invisible), logging will produce a slightly different result. The logged element shows in the same way it would in the element inspector. This is great for highlighting where it is on the page. It is also great for manually tweaking the attributes and content of it.
However, there’s a lot more to a DOM element than its markup. A whole host of available methods and properties are stored in its object that’s not immediately shown when simply logging it. To access these properties you can use console.dir to force the logged element into its navigable object format, letting you expand nested data and view its available methods.
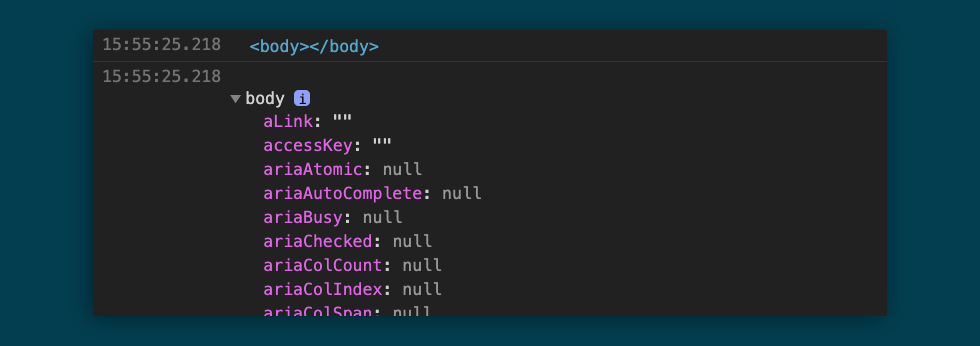
An example of regular DOM element logging and console.dir logging showing the element properties
Working with objects & arrays
As well as logging simple strings, console logs can be used to inspect more complex types. Logging an array or an object will give a small interface for navigating the data within them.
You’ll often find that logging large arrays of data can become difficult to navigate and read, especially in the case of logging arrays of objects. You have to expand the arrays, locate your object and expand that, and in some cases you’ll need to expand countless objects just to find the one with the data you’re looking for.
When logging an array of identically structured objects you can use console.table to format them into a tabular format for easy reading.
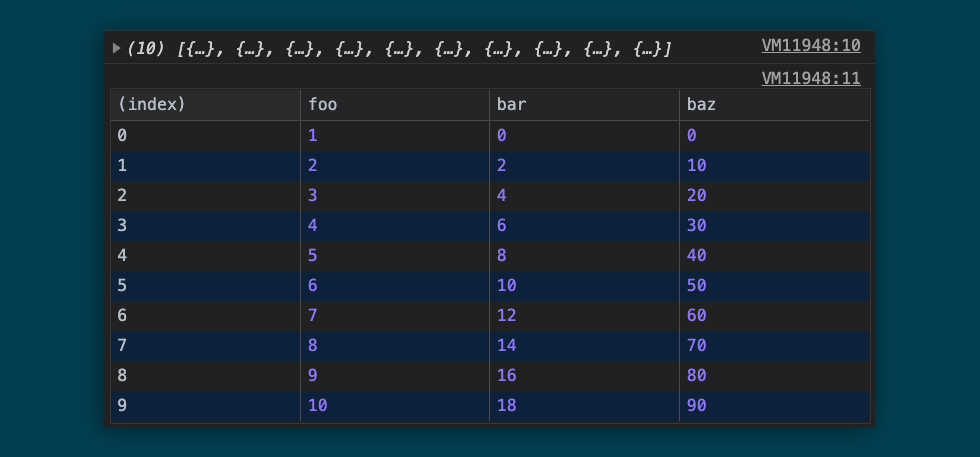
An array of objects logged both normally and formatted via console.table
Another concern when logging objects is that they may not show the data they had at the time of logging when you actually view the data. Due to the nature of objects being mutable in JavaScript, it’s possible that an object’s values can change in the time between logging and viewing this log. Sometimes this can work in your favour but often it’s misleading and confusing.
In these cases it’s best to clone the object while logging it to freeze that data in place using either the ES6 spread, Object.assign, or JSON approach:
console.log({...object}); // ES6 spread
console.log(Object.assign({}, object)); // Object.assign
console.log(JSON.parse(JSON.stringify(object))); // JSON
Tracking performance
The console can be used to track the speed of various parts of your scripts. console.time initialises a stopwatch with a given label that you can print out the currently elapsed time in milliseconds:
console.time('Label');
setTimeout(() => {
  console.timeLog('Label');
  setTimeout(() => {
    console.timeEnd('Label');
  }, 2000);
}, 1000);
Deeper inspection
So far we’ve explored how browser debugging can give you an insight into given states and variables but it’s possible to explore the context of certain points in your application too.
When building a complex object orientated application it’s possible to lose track of where a given function is firing and what path the script took to get to that point. By using console.trace we get a simple list of the function names in the call stack that were run to get to that given line.
Finally we come to the more advanced debugger command. If the developer tools of a supported browser are open at the time a script reaches this line, it will immediately pause the script execution in place and allow you to browse the entire call stack, the variables in the current scope of what’s being executed, and the global variables of everything above it.
This not only gives you the big picture of what’s going on without the need to log everything, but because it also pauses the script execution you can step forwards through the code seeing how it operates. This can be stepped forwards by individual lines or by entire function calls allowing you to get a more human understanding of operations that take milliseconds, even micro and nano seconds.
Demonstration of the debugger pausing a script to browse local & global scope variable and stepping through script execution.
Cleaning up
By now, your application has probably amassed quite a lot of logs and your console can look quite messy when running. It’s important to remove unnecessary console logs and debuggers as you go so you’re free to debug exactly what you need the next time you’re doing debugging in the browser.
The best way to keep on top of these is using lint rules (such as ESLint) to create warnings or even errors that flag up when your code is checked over and bundled.
In some cases these logs may be necessary for development builds but not for production builds. Many minifiers will offer options for removing console logging automatically upon optimisations (like UglifyJS) and many others have plugins available to do this for you (Like Babel’s remove-console plugin).
A little extra
One last often overlooked and albeit mostly useless feature of logging to the console is the ability to add styles to your messages using CSS by using the %c template placeholder.
console.log('%cHello world', [
  'background-image: linear-gradient(to top, #013140 0%, #023e50 100%)',
  'color: white',
  'padding: 0.5em 1.5em',
  'font-size: 18px',
  'font-weight: bold',
  'font-family: sans-serif',
  'border-radius: 1em',
  'text-shadow: 0 0.1em 0.3em rgba(0, 0, 0, 0.75)',
  'text-transform: uppercase',
].join(';'));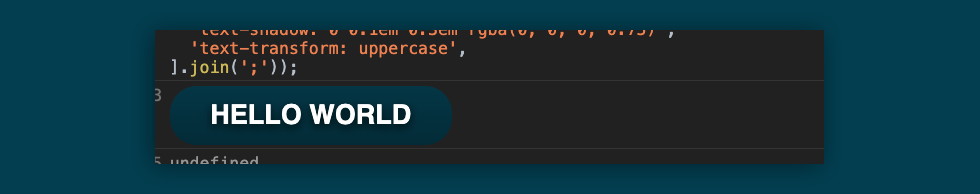
Whilst mostly pointless for regular development this feature has seen use in warning unwitting users away from the console in the potential case of a scammer directing them there to do something malicious.
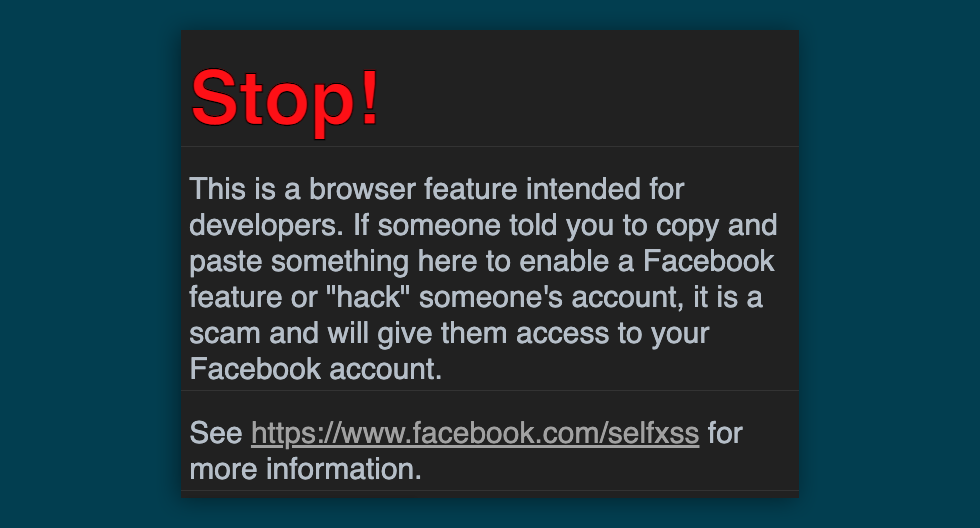
facebook.com using console log styles to warn users of the potential abuse of the console
Regardless of how much you find you use browser based debugging, it’s always important to keep tabs on the readability and optimisation of your code. Giving it a proofread to understand what you’ve written is just as important as logging what’s going on in the background to understand how it works.